Prioritize assessments
Find partners to invite using spend, business criticality and whether they already have an assessment.
EcoVadis · Enterprise sustainability
Helping sustainability and procurement managers understand their partner network, prioritize assessments and move from an overview to action.
Explore the case ↓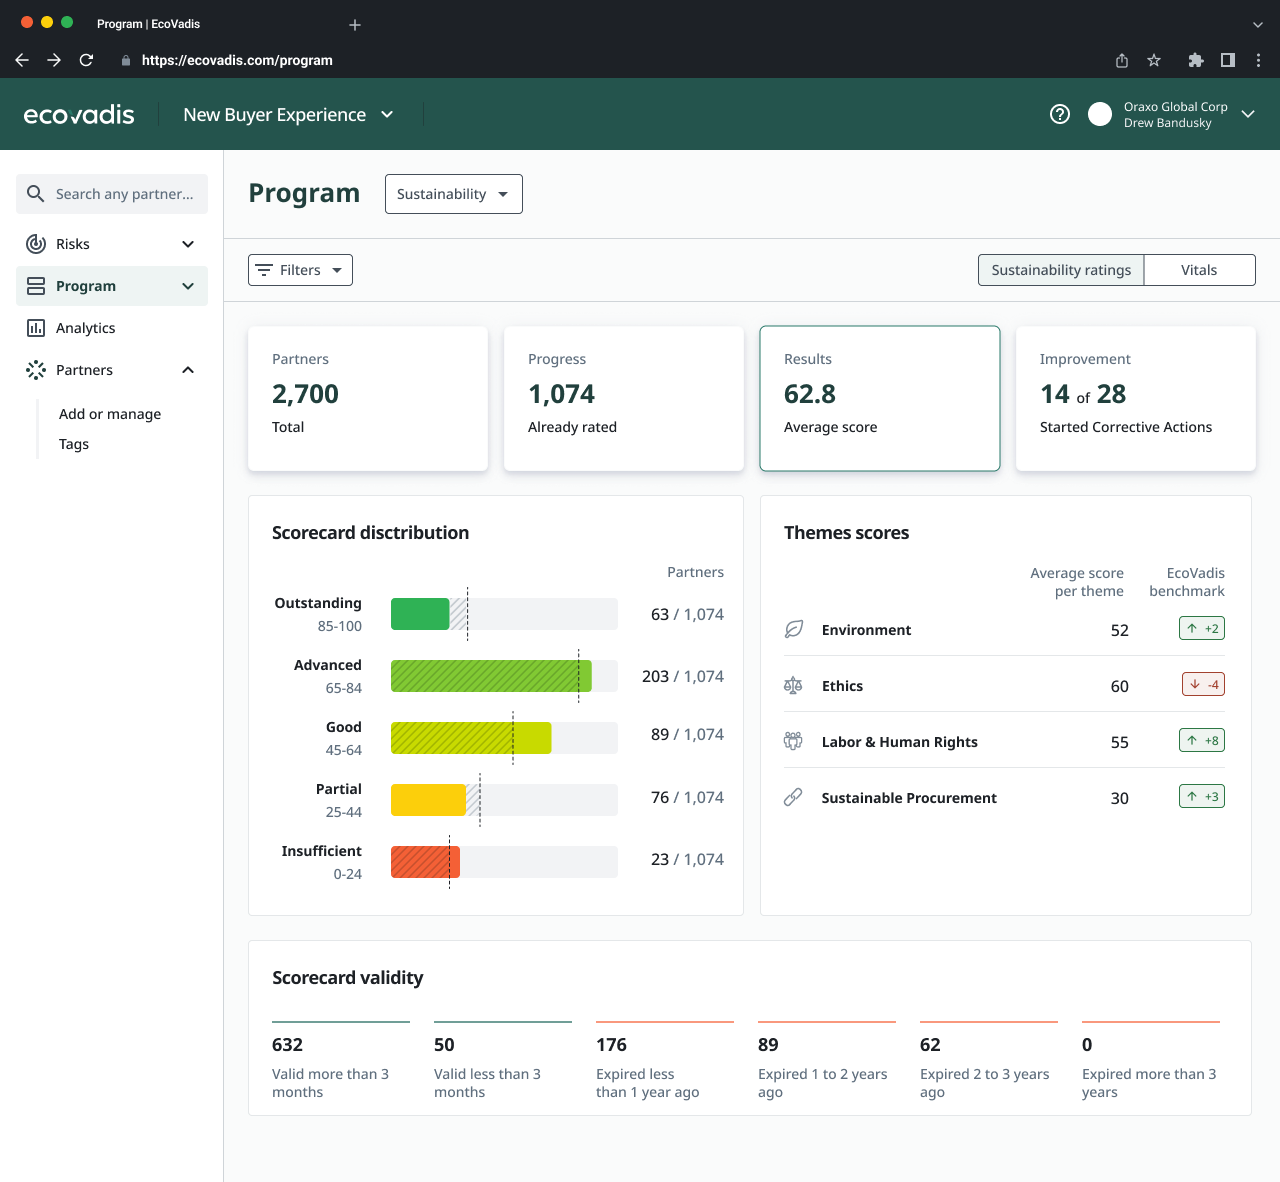
01 / The problem
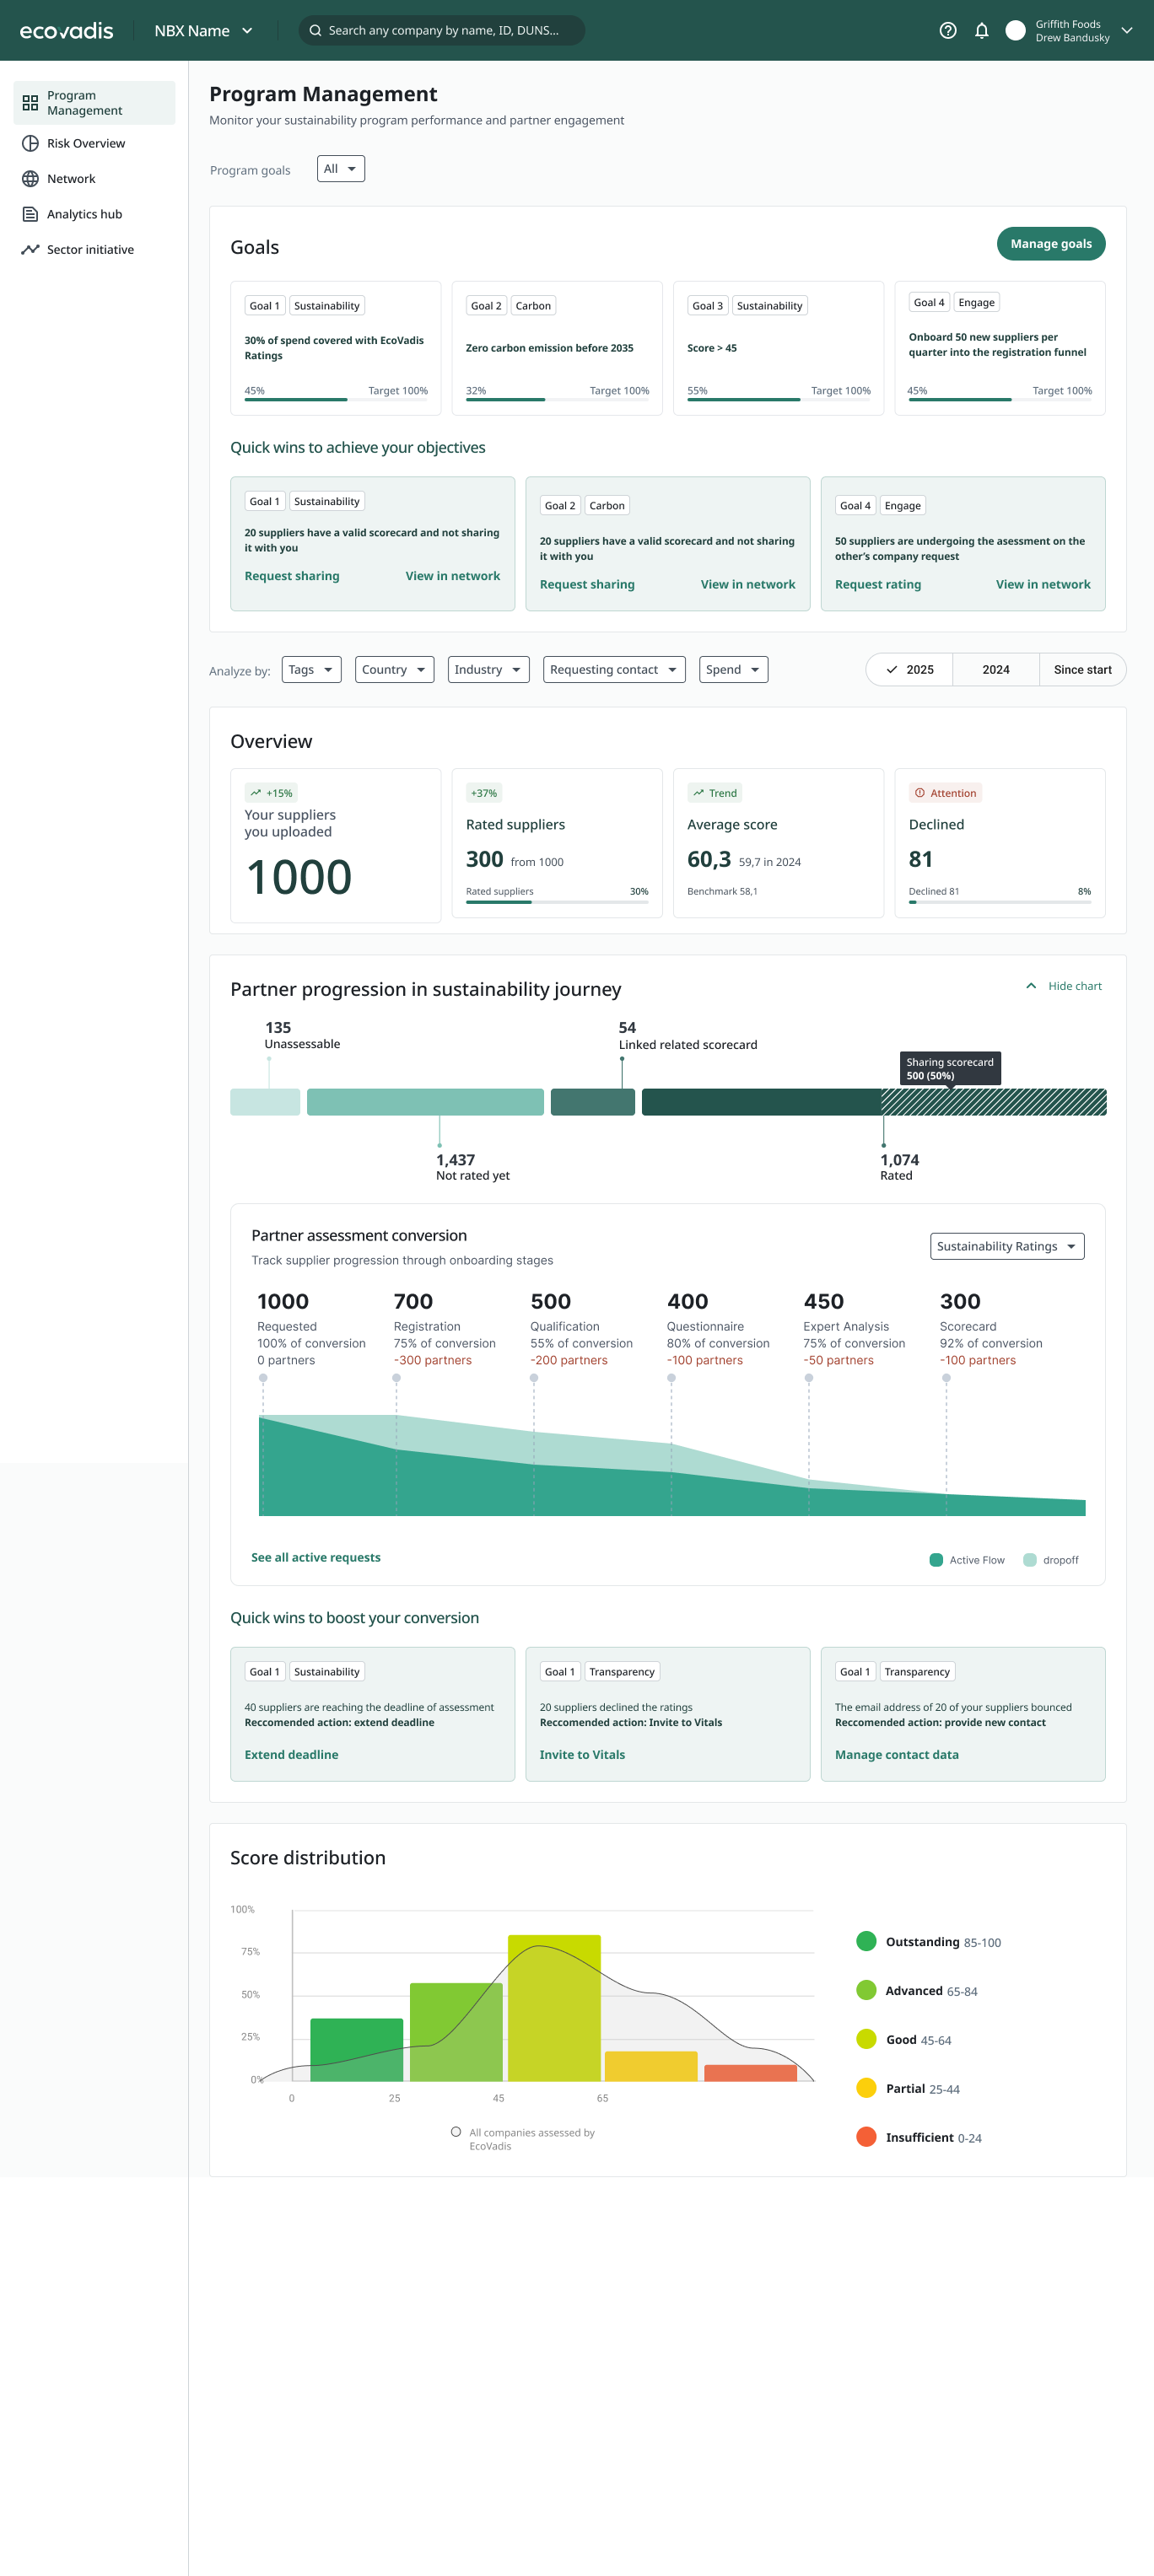
EcoVadis was bringing previously separate products and databases into a new platform. But a shared interface did not yet mean a shared understanding: customers encountered different partner counts, inconsistent statuses and unclear navigation.
An early design brought goals, progress, results and recommendations onto one long page. The challenge was not to add more data. It was to decide what belonged where—and make each view consistent with the rest of the product.
02 / Research
I conducted more than 15 user interviews and over 10 sessions with domain experts and Customer Success. Together with the PM and sustainability consultants, I used these findings and customer complaints to identify what users actually needed to do.
People had built their own workarounds: screenshots, documents and spreadsheets to compare results across years and explain progress to leadership. Their needs fell into three distinct jobs.
Find partners to invite using spend, business criticality and whether they already have an assessment.
Report the results of sustainability initiatives to leadership, including how performance changes over time.
Identify partners requiring attention and prepare corrective action plans.
03 / Key decisions
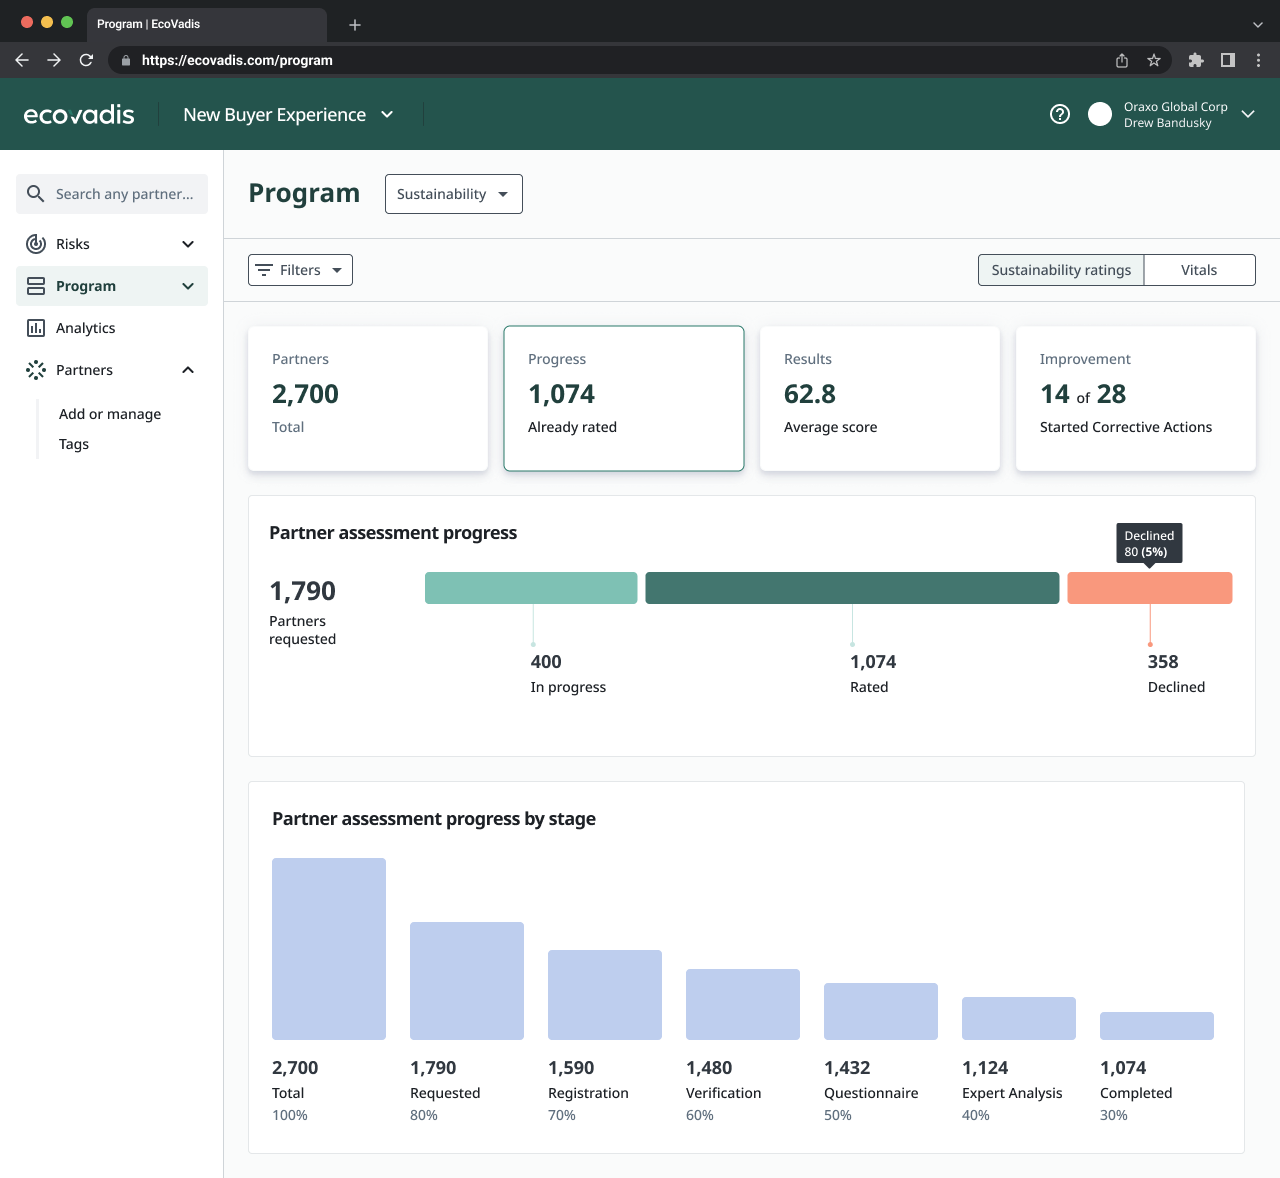
The PM and I considered combining Program and Analytics, then kept them separate to avoid duplicating data and overwhelming users. Program provides an aggregated view of participation and results; Analytics holds the detailed reporting. I designed its shell and entry points, not the reports themselves.
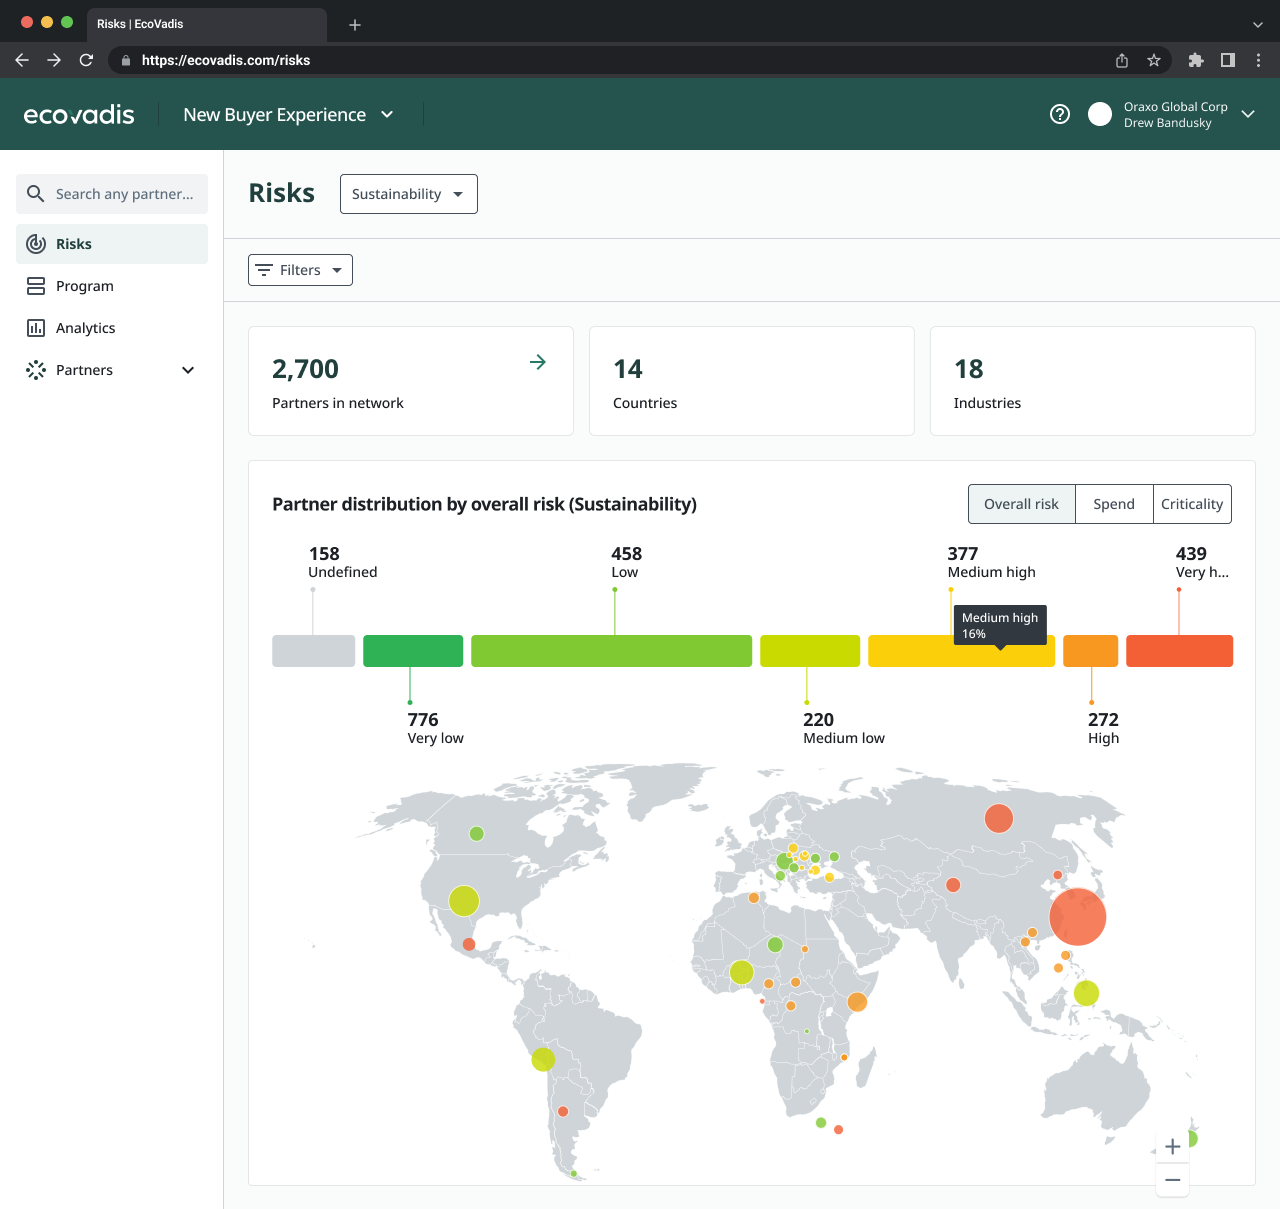
Risks later became a separate area. Country- and industry-based risk changes relatively slowly, while Program tracks ongoing assessment activity. Separating them reflected different decisions, not just different charts.
Across these areas, I reused the partner list’s filters and underlying logic rather than introducing another way to define the same group of partners.
04 / The experience
The core interaction connects a chart segment to the corresponding filtered partner list. Users can move from seeing a pattern to identifying the partners behind it, then take the relevant next step.
This connects the overview with assessment invitations and work on corrective actions, instead of leaving users to reconstruct a group manually elsewhere in the platform.
05 / Carbon complexity
Carbon added another layer of complexity. Its methodology and measures differ from sustainability ratings, so the experience could not simply reuse the same charts with different labels.
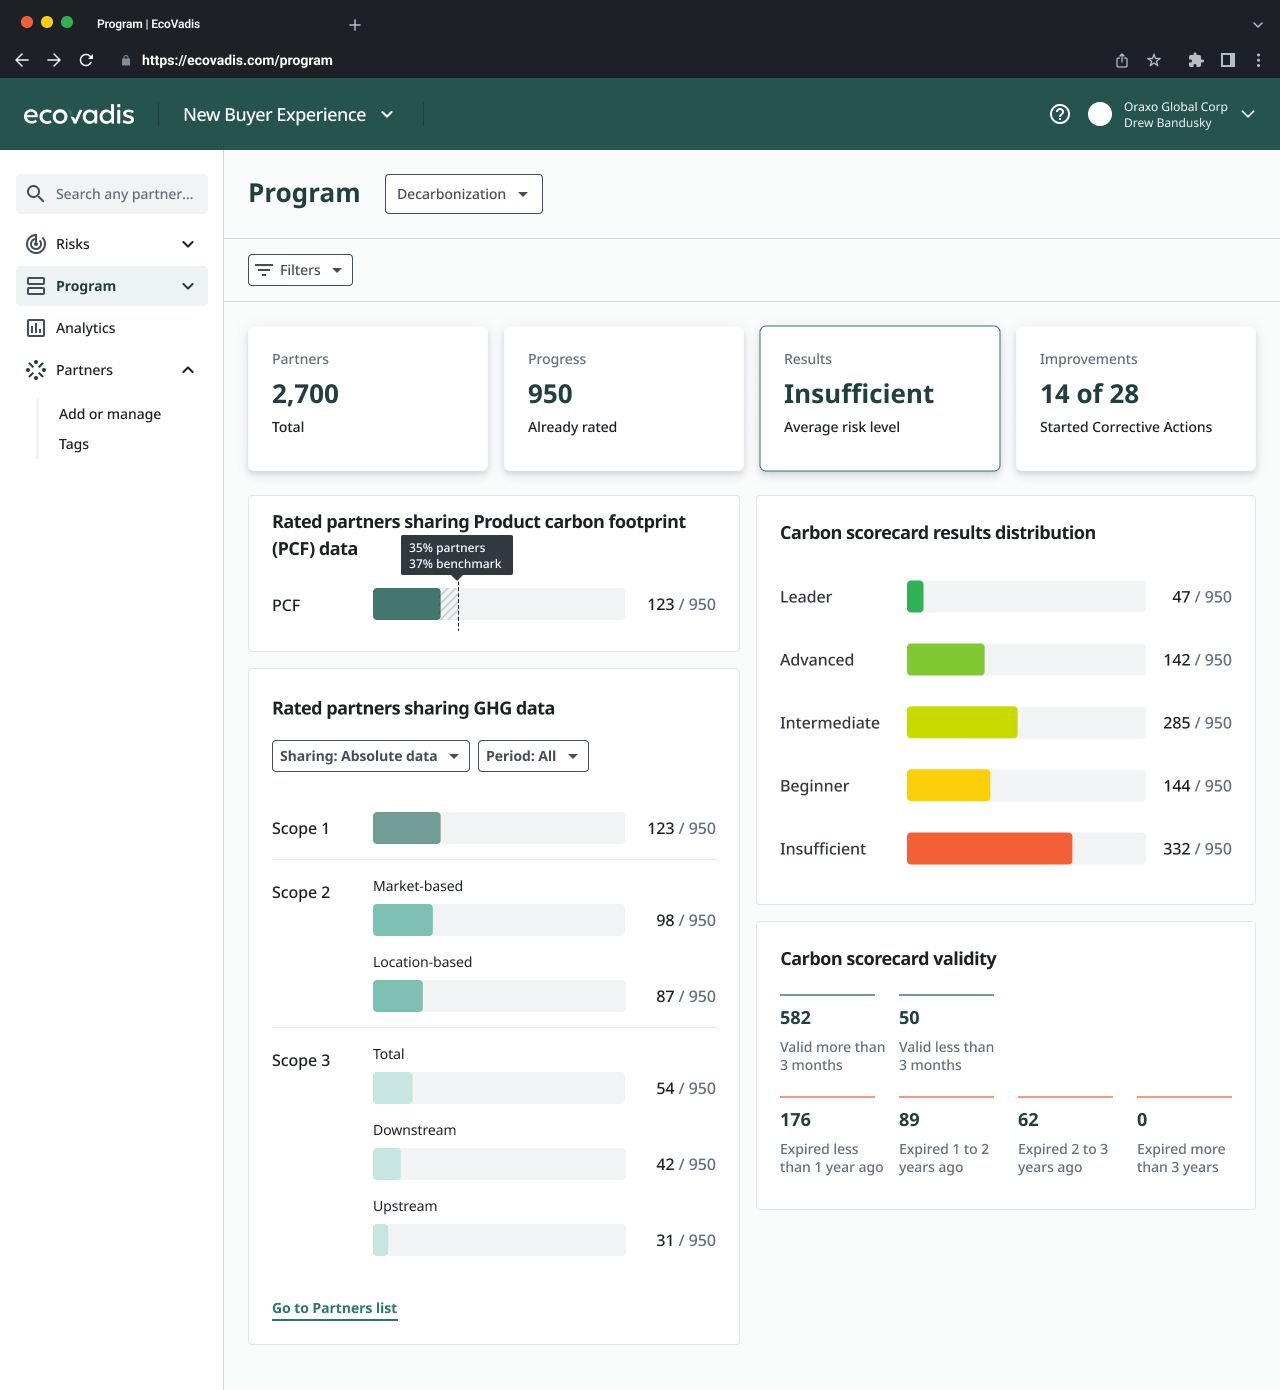
I kept the familiar Program structure while adapting the results view to carbon-specific questions: which partners share product carbon footprint and greenhouse gas data, how that coverage differs across emissions scopes, and how partners are distributed across carbon scorecard levels.
The design brings these distinctions into a shared navigation and filtering model. Users can work within a familiar experience without losing the detail that makes carbon data meaningful.
06 / Validation & next steps
Users responded positively to the direction. Their feedback reinforced the distinction between charts used to prioritize partners and charts used to explain results to leadership.
The selected Program and Risks designs moved into development. The value of the design was in a clearer division of responsibilities, shared filtering logic and a direct path from aggregate data to individual partners.
Historical comparisons remained a need for later phases. They were not part of this development scope, and there are no post-launch impact metrics to report yet.