Fit into daily life
Customizable reminders support blood-pressure checks and medication routines.
Fitbit · Health guidance
Helping people understand their blood-pressure data, build routines and bring useful context into conversations with healthcare professionals.
Explore the case ↓01 / The problem
Blood-pressure tracking involves more than recording a number. People need to establish a measurement routine, remember medication and understand their readings over time.
The design challenge was to connect these activities in a mobile experience that makes health data understandable without turning the interface into a diagnosis.
02 / Research & exploration
I worked with UXR on interviews and surveys to understand people’s routines, needs and pain points, and reviewed existing solutions through competitive analysis. Cross-functional workshops with Product, Engineering, researchers and a health advisor helped explore possible approaches.
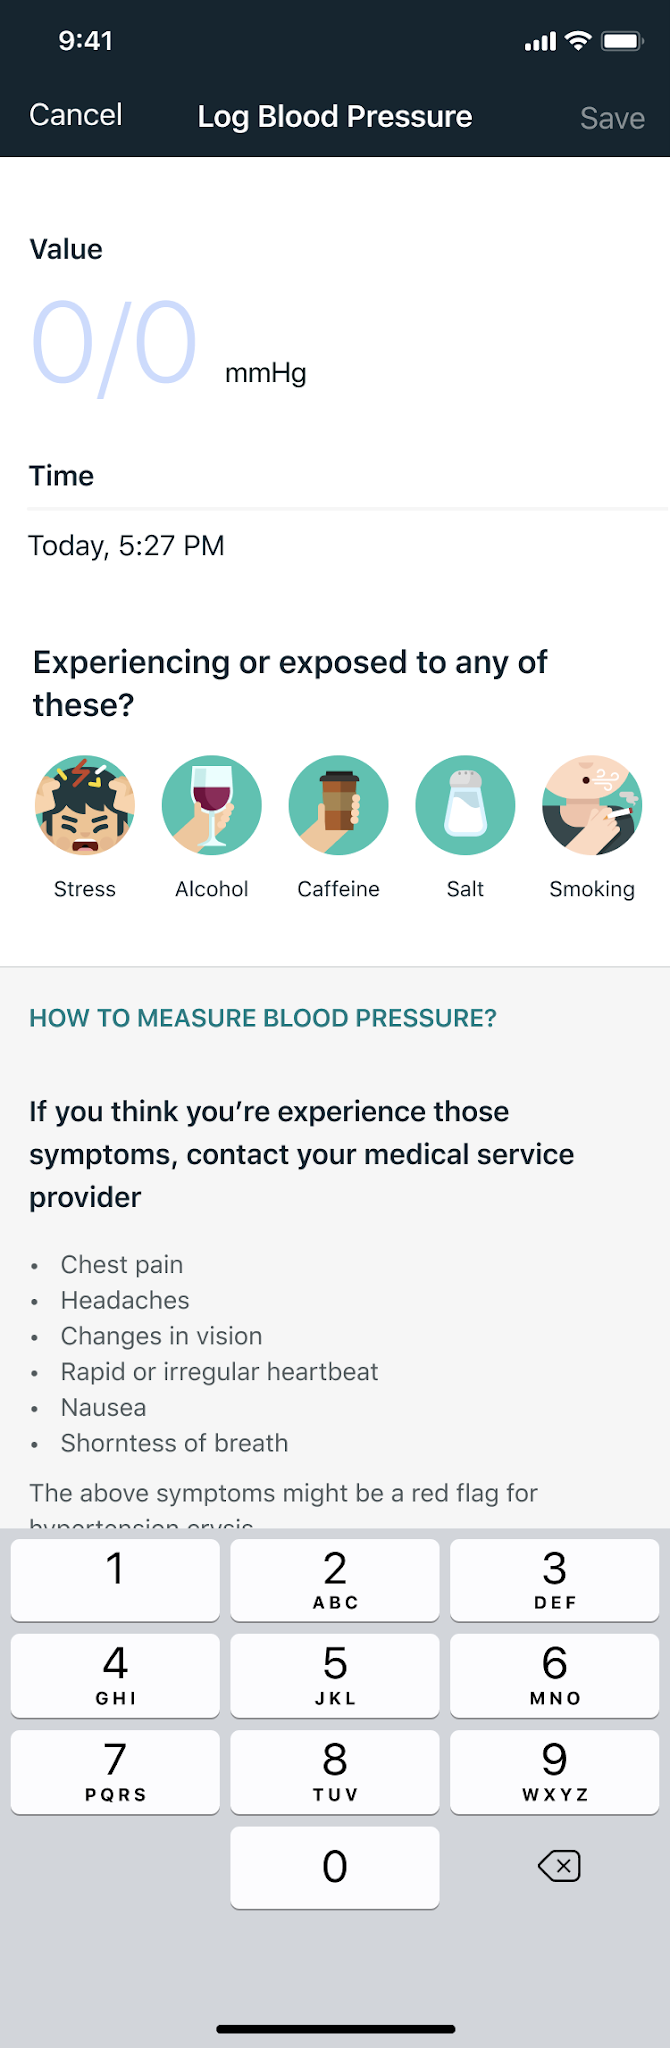
I developed wireframes and interactive prototypes to explore and refine those ideas. The logging experience brings a reading, its time and relevant lifestyle context together, rather than treating each measurement as an isolated number.
03 / Key decisions
Customizable reminders support blood-pressure checks and medication routines.
Connect readings with lifestyle factors to help people explore patterns over time.
Bring readings and trends into an exportable report that can support a conversation with a healthcare professional.
04 / The experience
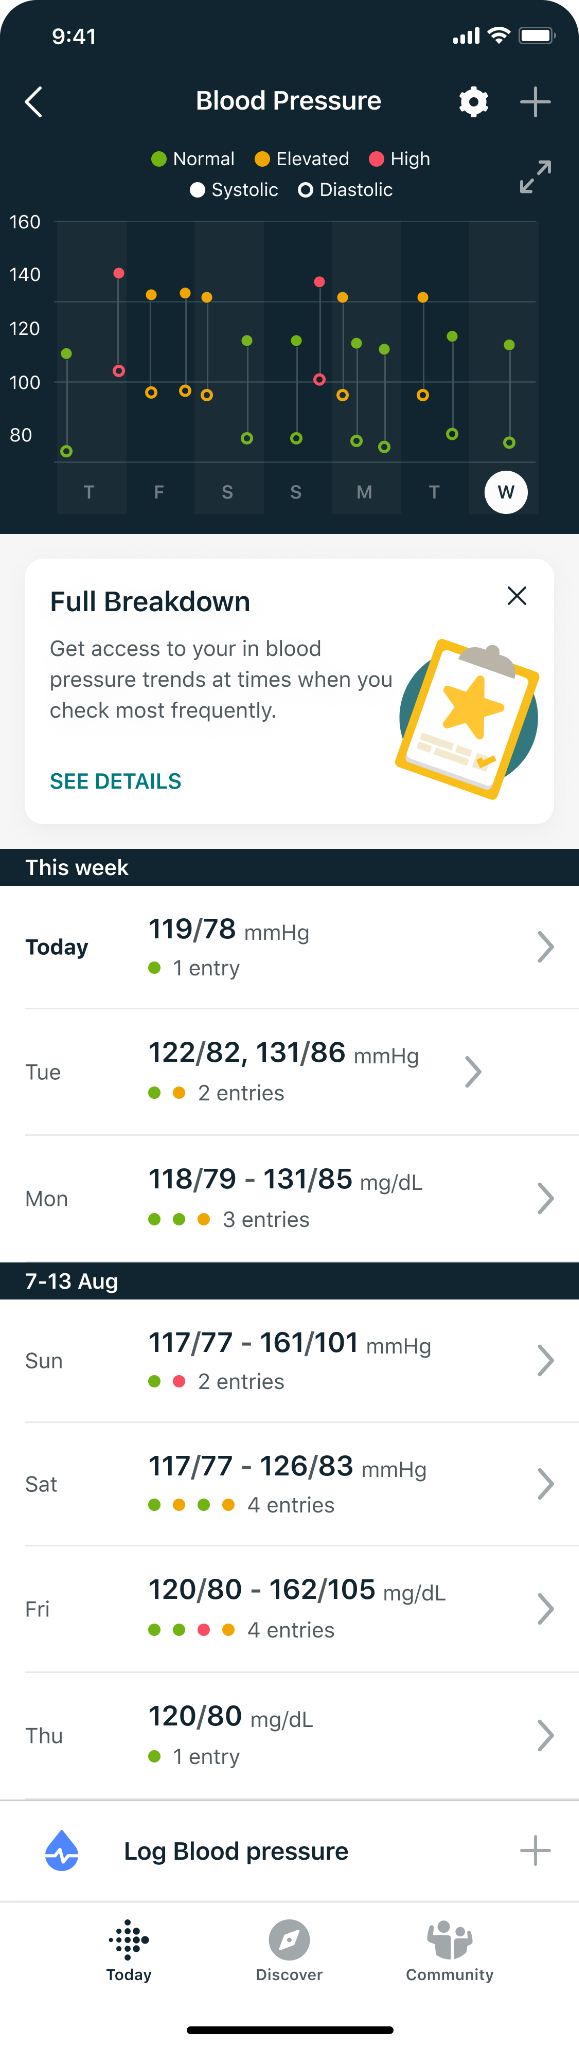
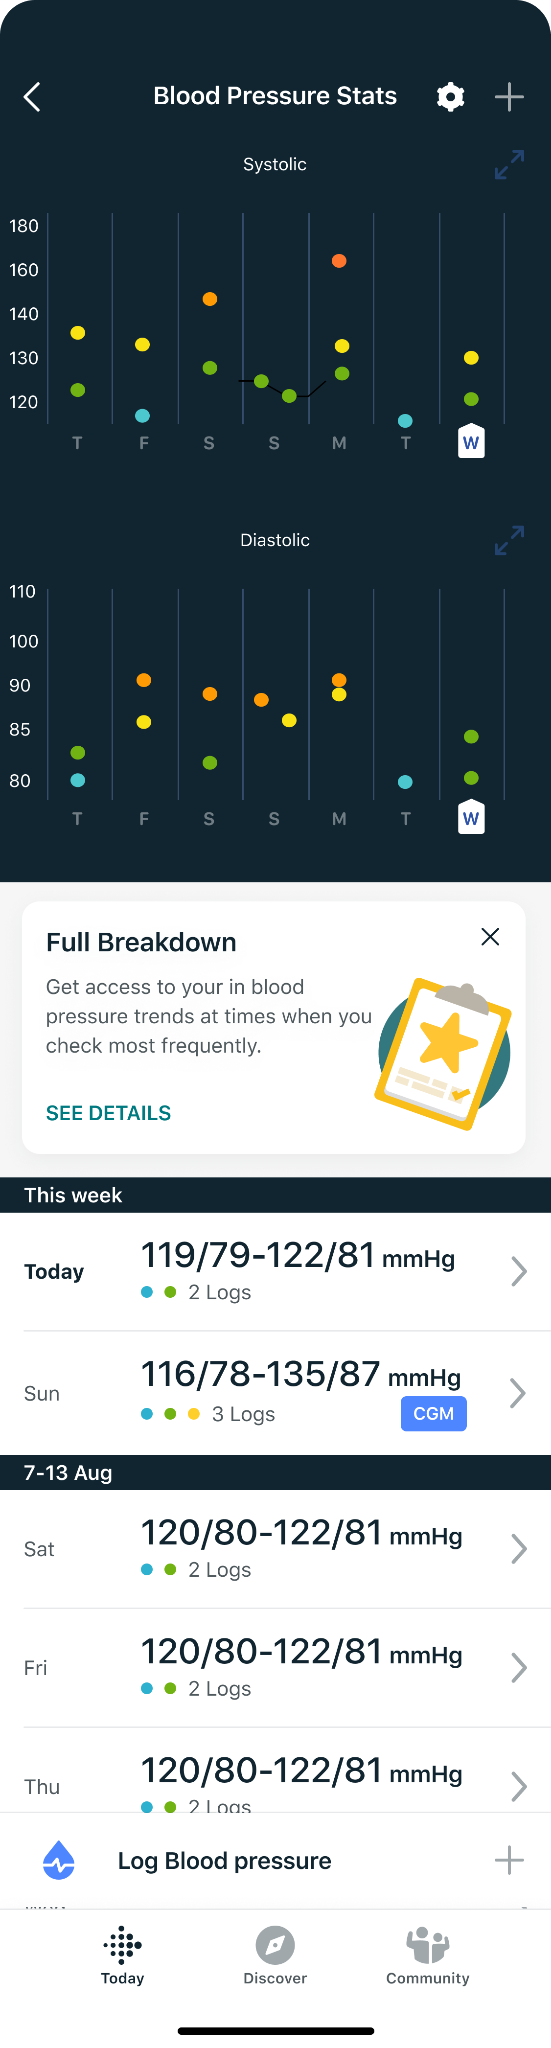
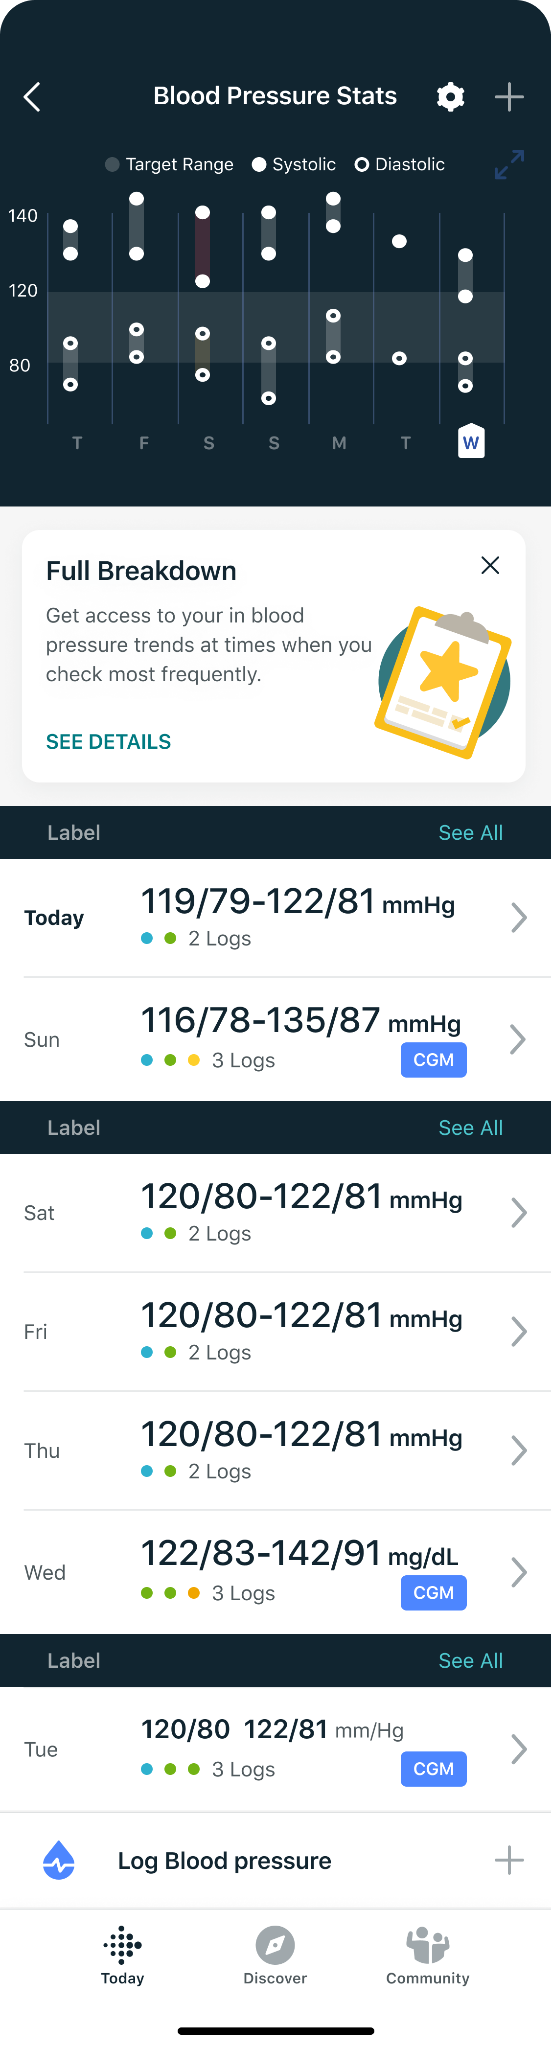
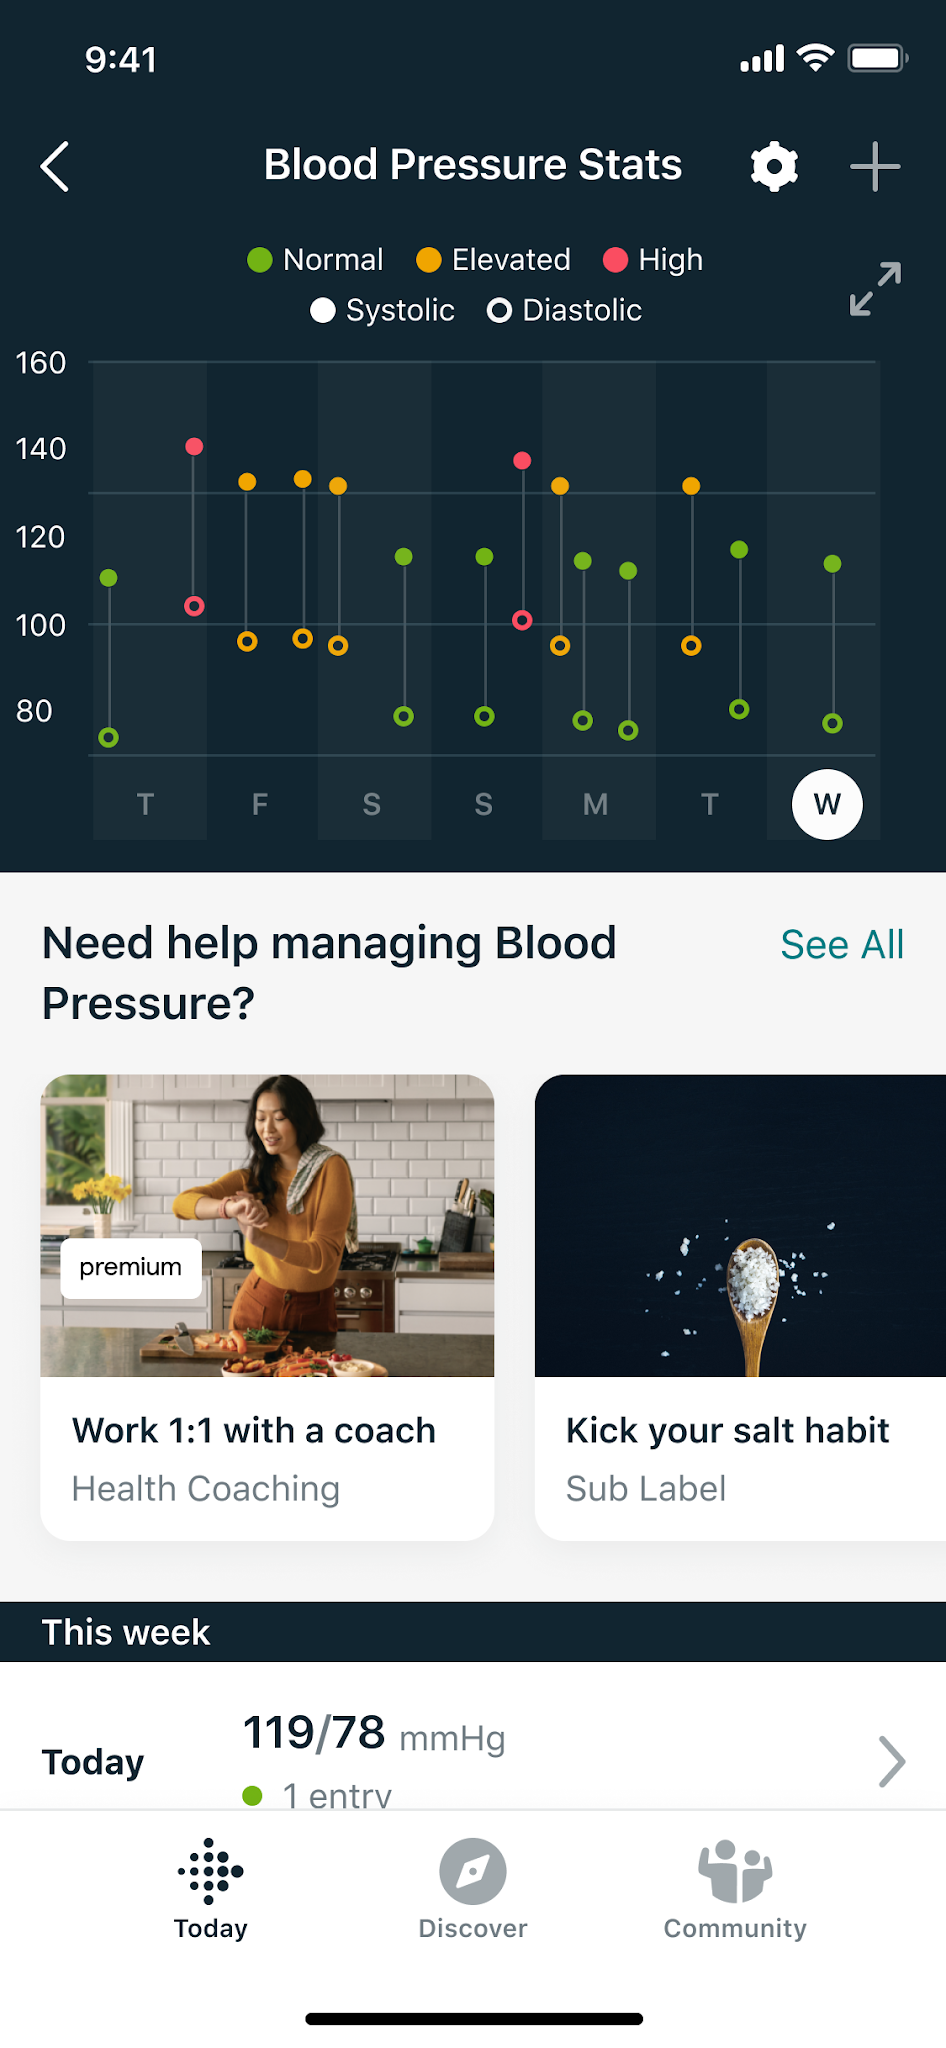
The mobile experience connects logging with a view of blood-pressure trends. Reminders encourage a regular routine, while contextual information helps people review their history.
The goal was to make ongoing tracking easier to follow, with each interaction contributing to a more useful picture over time.
Beyond the app / Wellness Report
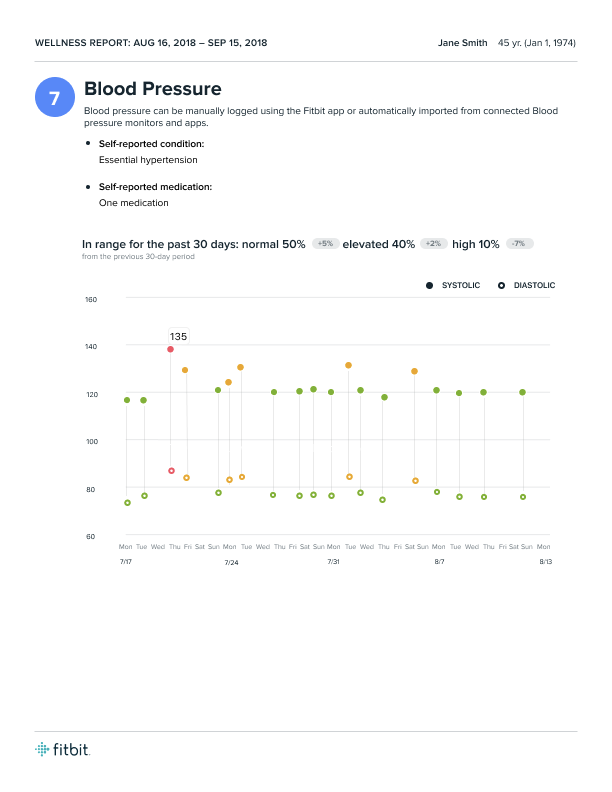
The Wellness Report combines readings, context and trends in an on-demand PDF. People can take it to a healthcare professional rather than navigating through individual app screens during an appointment.
The report provides a shared starting point for discussion. It supports understanding and communication, without claiming to replace clinical interpretation.
05 / Testing & refinement
Usability testing included different chart variations to explore which representations felt most familiar to users. Feedback from testing informed further design iterations.
I worked with Engineering on feasibility, a technical writer on final copy, and the wider design team on reviews. Detailed handoff documentation and team bug bashes helped check the implemented experience.